BDSwiss App
Download & start trading

Previous Trading Day’s Events (19.06.2024)
Markets priced in a 30% chance of a BoE first cut by August from around 50% before the data, while expecting 44 bps of monetary easing in 2024 from almost 50 bps before the data.
“For now, we are sticking with our forecast that the bank will first cut interest rates from 5.25% in August, although that relies on better news on services CPI inflation and wage growth in the coming months,” said Ruth Gregory, deputy chief economist at Capital Economics.
“The big question is whether the bank sticks to previous guidance and primes the market for an August kick-off to a rate-cutting cycle,” said Jamie Dutta, market analyst at Vantage, after forecasting no decision on rates by the BoE on Thursday.
Source: https://www.reuters.com/markets/currencies/sterling-edges-up-after-uk-inflation-data-2024-06-19
______________________________________________________________________
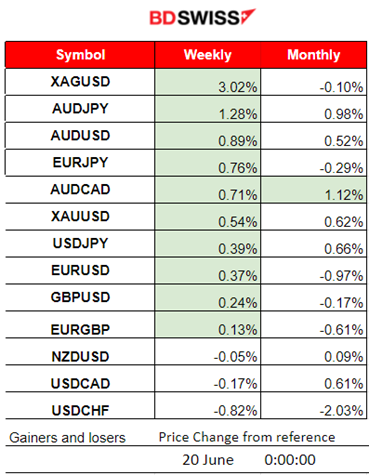
Winners vs Losers
Silver climbed to the top of the list as metals showed remarkable momentum to the upside for the last couple of days. It has reached 3% performance this week so far. For the month AUDCAD is leading with 1.12% gains. The dollar remained stable yesterday but at low levels that were kept since the weak retail sales report.
 ______________________________________________________________________
News Reports Monitor – Previous Trading Day (19.06.2024)
Server Time / Timezone EEST (UTC+03:00)
No important announcements, no special scheduled releases.
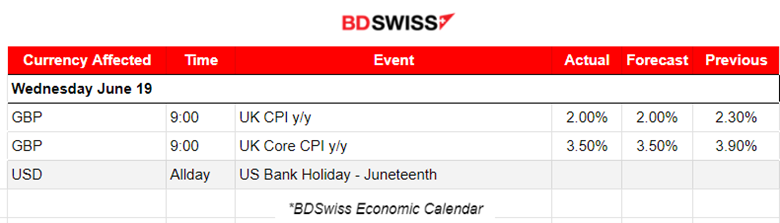
As per the U.K.’s CPI data report at 9:00, the Consumer Prices Index (CPI) rose by 2.0% in the 12 months to May 2024. As expected and on target finally! 2% reached. However, the market responded with GBP appreciation upon release.
General Verdict:
 __________________________________________________________________
FOREX MARKETS MONITOR
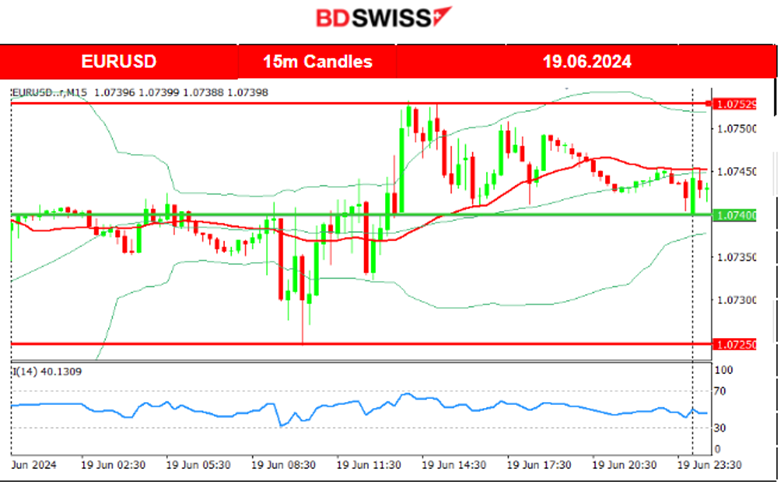
EURUSD (19.06.2024) 15m Chart Summary
Server Time / Timezone EEST (UTC+03:00)
Price Movement
The pair experienced volatility after the start of the European session but remained on a sideways path. There was an absence of important releases that kept more pairs stable. The dollar was barely affected and the U.S. holiday played a role in this. EURUSD deviated from a max of 15 pips from the mean and stayed within a 30 pips range.
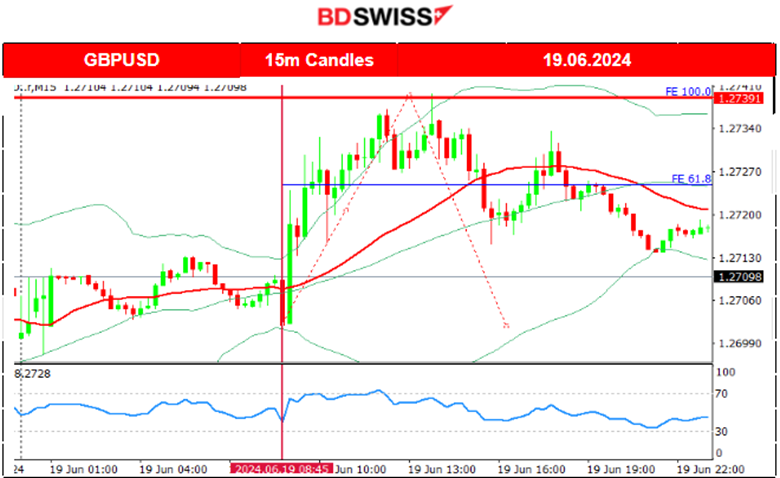
 GBPUSD (19.06.2024) 15m Chart Summary
Server Time / Timezone EEST (UTC+03:00)
Price Movement
The pair moved sideways with low volatility before 9:00. However that changed when at that time the CPI data for the U.K. was released showing that annual inflation has reached the 2% target level as expected. The priced-in news caused a GBP appreciation pushing the pair to the upside. GBPUSD reached the resistance of 1.27390 before eventually retracing to the 61.8 Fibo level and back to the 30-period MA where it settled, moving even lower until the end of the trading day, staying under the MA.
 ___________________________________________________________________
CRYPTO MARKETS MONITOR
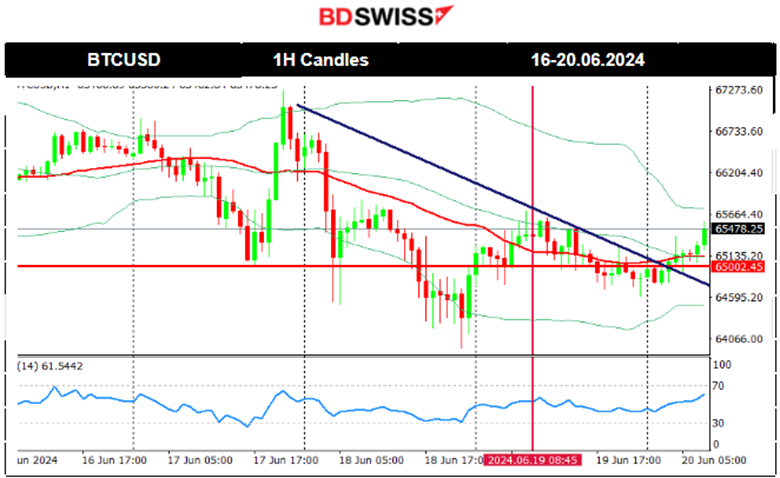
BTCUSD (Bitcoin) Chart Summary 1H
Server Time / Timezone EEST (UTC+03:00)
Price Movement
When the weekend passed, on the 17th, the market started to get active again and volatility labels rose. The price fell to 65K before reversing to the upside quite rapidly finding resistance close to 67,200 USD before retracing to the intraday mean. On the 17th, the price saw a fall reaching a support near 64,500 USD before it finally retraced to the 30-period MA. On the 18th, the price broke, and that support moved lower until it reached the next support at near 64K USD. Retarcement back to the 30-period MA followed soon indicating that the 65.5 USD acts as the important weekly mean. On the 20th the price moved to the upside breaking the upper band of a triangle formation and potentially stalled at 65,500 USD for now, unless it breaks, thus triggering a jump to higher levels.
 Crypto sorted by Highest Market Cap:
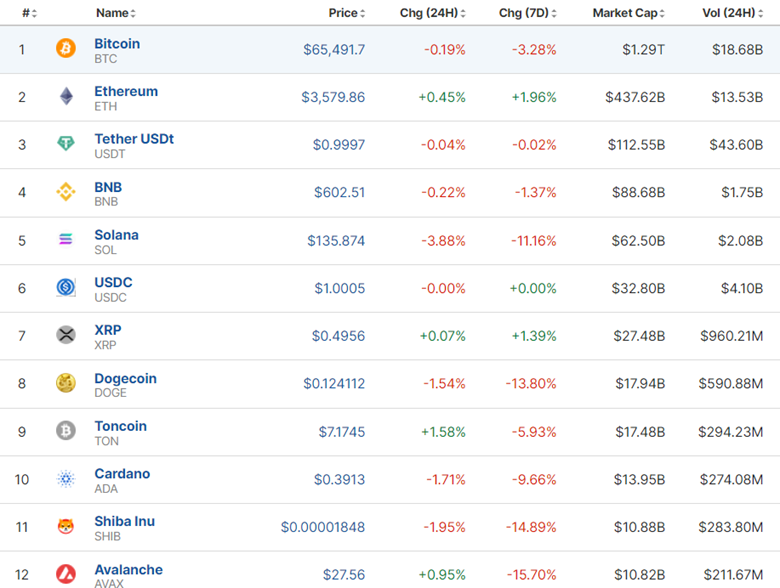
The market is not improving. Prices remained stalled lower.
https://www.investing.com/crypto/currencies
______________________________________________________________________
EQUITY MARKETS MONITOR
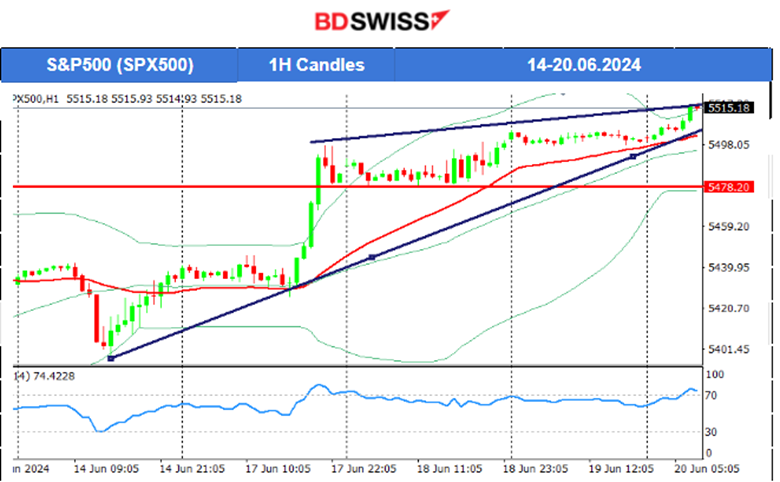
S&P500 (SPX500) 4-Day Chart Summary
Server Time / Timezone EEST (UTC+03:00)
Price Movement
A triangle formation was broken to the downside on the 14th of June and support near 5,400 USD was reached as mentioned in our previous analysis. The index reversed fully after that and it moved slightly above 5,440 USD, above what looks like to be a channel now. The level 5,445 USD acted as a resistance and it was broken on the 17th. The index jumped to the next resistance at near 5,500 USD before a slowdown. Retracement did not take place since 5,479-5,480 USD was not broken. Instead, it acted as a strong support that caused the index to bounce and move to the upside. After a slow trading day for index futures and a U.S. holiday, the market opened on the 20th higher, breaking the resistance with momentum to the upside, being part of an upward wedge formation.
 ______________________________________________________________________
COMMODITIES MARKETS MONITOR
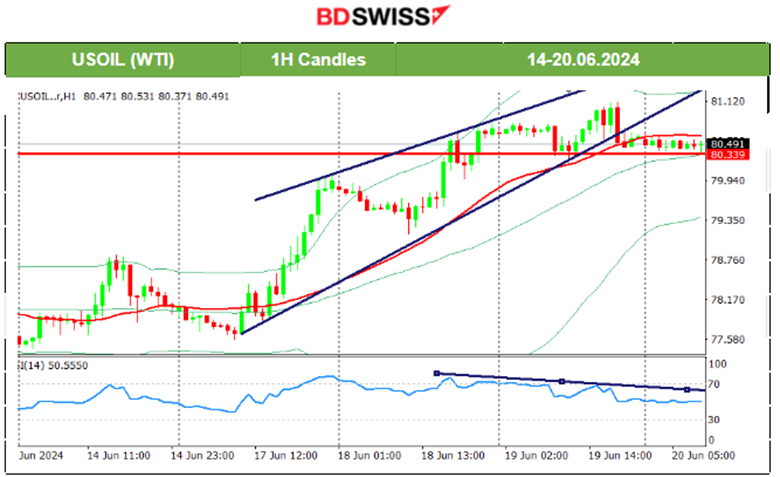
USOIL (WTI) 4-Day Chart Summary
Server Time / Timezone EEST (UTC+03:00)
Price Movement
The price of Crude oil was in a consolidation phase after a long uptrend. On the 17th the price moved above the 79 USD/b resistance and succeeded in a breakout of the upside, moving quite rapidly and reaching the next resistance at near 80 USD/b. Retracement took place on the 18th with the price returning to the 79.10 USD, 61.8 Fibo retracement level. However, on the same day, it turned to the upside, broke the 80 USD/b level and moved further upwards. Crude oil is breaking May’s resistance levels but stalled on the 81 USD/b level. On the daily chart, it is apparent that crude was on a reversal, crossing the 30-period MA on its way up. That uptrend took too long though as fundamentals were pushing the price higher and higher. Could this be the turning point for the downside? The 78 USD/b level seems to act as the chart’s mean and it happens that it is on the 61.8 Fibo level. A retracement is probable. On the H1 chart, the RSI is signalling a bearish divergence, supporting this view. Let’s see if the resistance at 81 USD/b will be tested again and if it will hold.
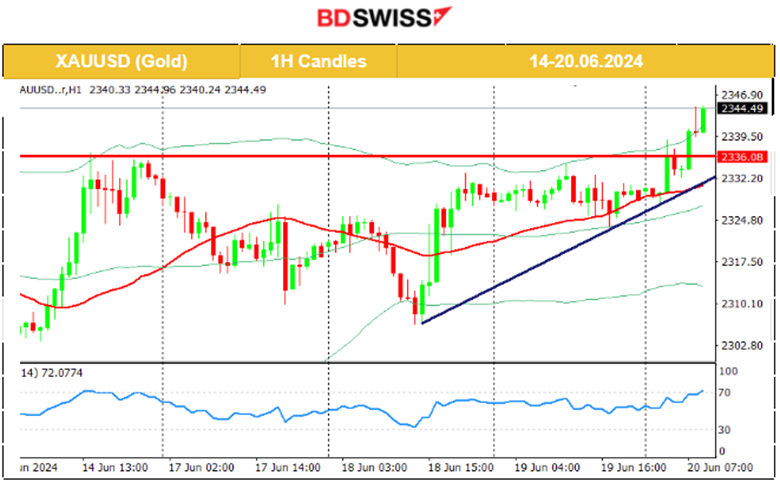
 XAUUSD (Gold) 4-Day Chart Summary
Server Time / Timezone EEST (UTC+03:00)
Price Movement
On the 14th of June, the price reversed to the upside and tested the resistance again, at near 2,340 USD/oz unsuccessfully. It reversed back to the 30-period MA and remained on a consolidation path with the mean price at near 2,320 USD/oz. A triangle was formed as volatility levels lowered and on the 18th of June, that triangle was broken to the downside. However, instead of the price moving lower, the weak U.S. retail sales figures caused USD depreciation on the 18th pushing gold to the upside. Another triangle formation was visible as it found resistance. The resistance broke on the 20th of June with Metals in general experiencing a rise in prices despite the dollar strengthening. That’s supply and demand in the works. The 2,350 USD/oz seems to be the target level for the upside, considering the breakout, plus the technicals.
 ______________________________________________________________
News Reports Monitor – Today Trading Day (20.06.2024)
Server Time / Timezone EEST (UTC+03:00)
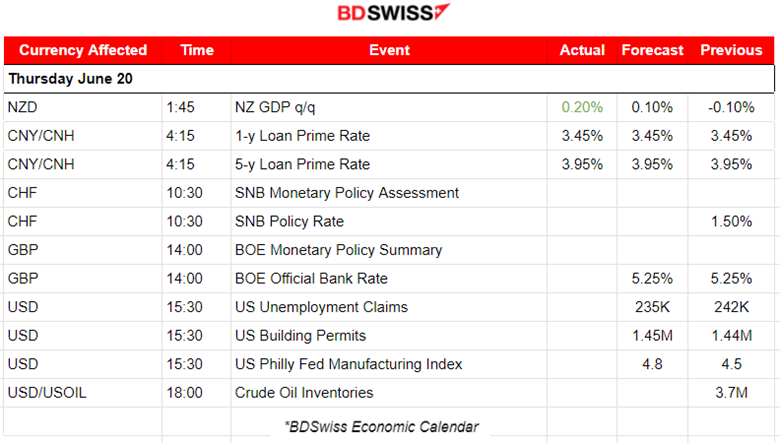
At 1:45, the New Zealand dollar saw a surprisingly strong appreciation against the U.S. dollar, driven by stronger-than-expected GDP data for the first quarter. New Zealand’s economy grew by 0.2% quarter-on-quarter in Q1, up from 0% in the previous quarter, surpassing expectations. A retracement took place soon after the release and it ended up as a full reversal to the intraday MA.
The SNB will decide on rates at 10:30. Investors remain uncertain about policymakers’ next step since the central bank switched to easing, cutting the policy rate down to 1.5% from 1.75%. The CHF pairs might see an intraday shock at the time of the announcement. Keeping rates low could cause the dollar to strengthen significantly against the CHF if the market conditions remain steady.
The BOE will announce their decision on interest rates as well at 14:00. The expectation is that there will be no change in rates. BOE is expected to keep OBR high at 5.35%. If inflation however is reported lower prior to this decision, there is a high probability of a surprise cut from the BOE and the GBP pairs to experience a huge level shock at the time of the release, obviously with GBP weakening.
The U.S. unemployment claims are expected to be reported lower at 15:30, a pullback from the high 242K figure. The USD pairs could see some high volatility upon release if activity levels in the market remain high. The reduction in claims could be valid considering the fact that the labour market in the U.S. is showing strength still.
General Verdict:
______________________________________________________________
 Marios Kyriakou
Posted on 06 September, 2024 at 10:55 GMT
Posted on 05 September, 2024 at 10:53 GMT
Posted on 04 September, 2024 at 12:19 GMT
Posted on 03 September, 2024 at 12:45 GMT
Posted on 02 September, 2024 at 10:36 GMT