BDSwiss App
Download & start trading

Previous Trading Day’s Events (18.06.2024)
“While recent data have been mixed, they have reinforced the need to remain vigilant to upside risks to inflation,” the RBA Board said in a statement.
At 3.6%, inflation remains well above the bank’s target band.
Source: https://www.reuters.com/markets/rates-bonds/australias-central-bank-holds-cash-rate-435-2024-06-18/
Nonetheless, inflation and higher interest rates are testing the resilience of consumers. Retail sales bolstered economists’ expectations that the Federal Reserve could still start cutting interest rates in September. U.S. central bank officials last week saw the anticipated rate cut delayed to perhaps as late as December.
Source:
https://www.reuters.com/markets/us/us-retail-sales-miss-expectations-may-2024-06-18/
______________________________________________________________________
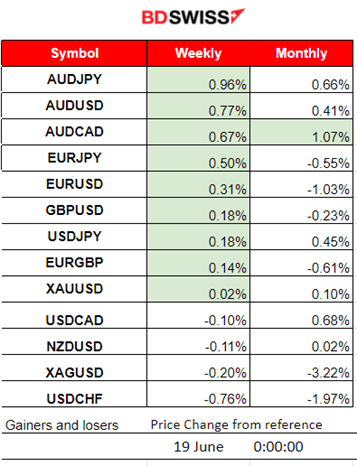
Winners vs Losers
AUDJPY climbed to the top with 0.96% gains. The AUD gained ground since Australia’s central bank kept the cash rate at 4.35%. The JPY is still suffering. The USD weakened due to disappointing retail sales reports.
 ______________________________________________________________________
News Reports Monitor – Previous Trading Day (18.06.2024)
Server Time / Timezone EEST (UTC+03:00)
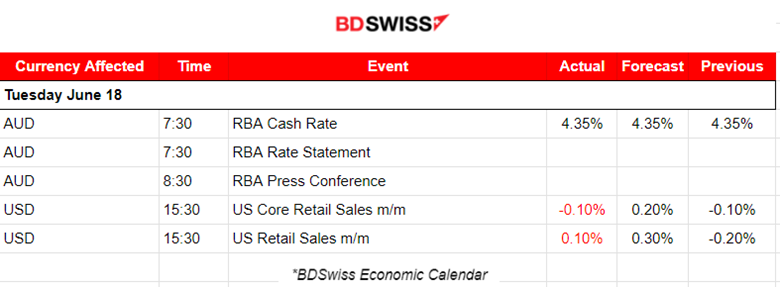
At 7:30 the RBA announced their decision to leave the cash rate unchanged at 4.35%, as expected. The current rate, the highest since September 2011, has been unchanged since November 2023. Conditions in the labour market eased further over the past month. However, over the year to April, the monthly CPI indicator rose by 3.6% in headline terms. The market reacted with a moderate intraday shock. The AUD depreciated slightly and the effect was reversed quite soon.
The U.S. core retail sales figures were reported at 15:30. It was a miss since retail sales have not grown as expected and the Core figure showed a surprising decline. These data confirm that high interest rates and inflation continued to weigh on consumers and support the recent views of the Fed regarding future inflation cooling. The central bank is estimating one interest rate cut this year. The USD depreciated at that time.
General Verdict:
 __________________________________________________________________
FOREX MARKETS MONITOR
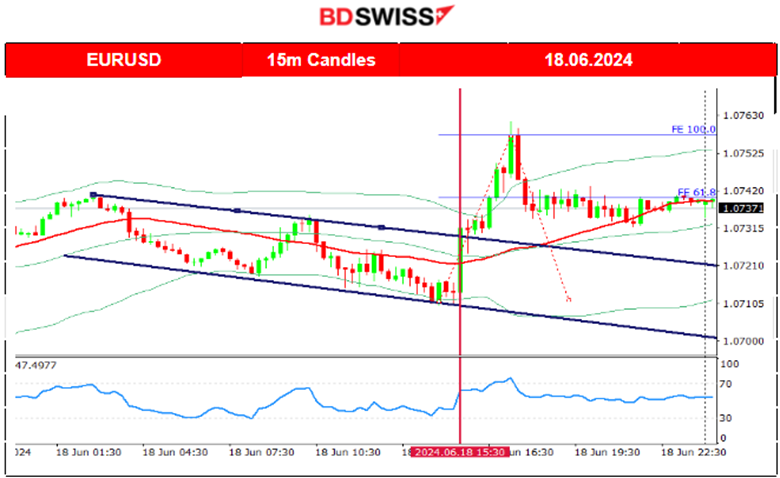
EURUSD (18.06.2024) 15m Chart Summary
Server Time / Timezone EEST (UTC+03:00)
Price Movement
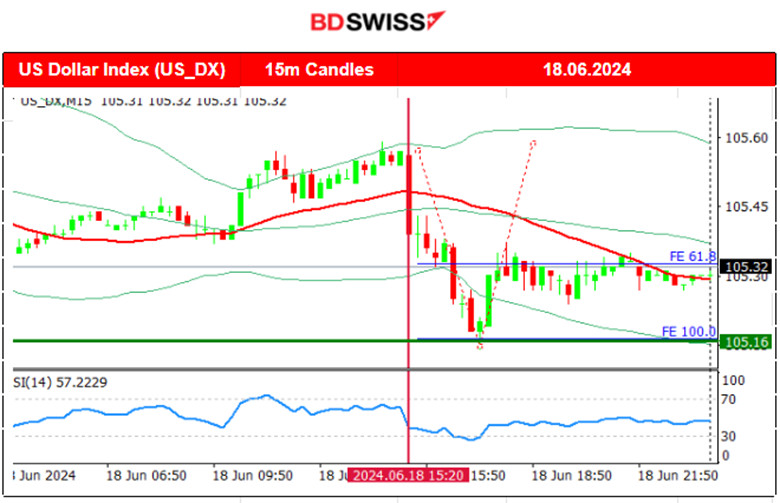
The pair was moving steadily downwards and around the 30-period MA. The market was not experiencing too much volatility since there was an absence of major releases before the U.S. Retail Sales news. At the time of the release, the USD depreciated greatly from the grim retail sales figures that caused the pair to jump, reaching the resistance of 1.07615 before it retraced back to the MA.
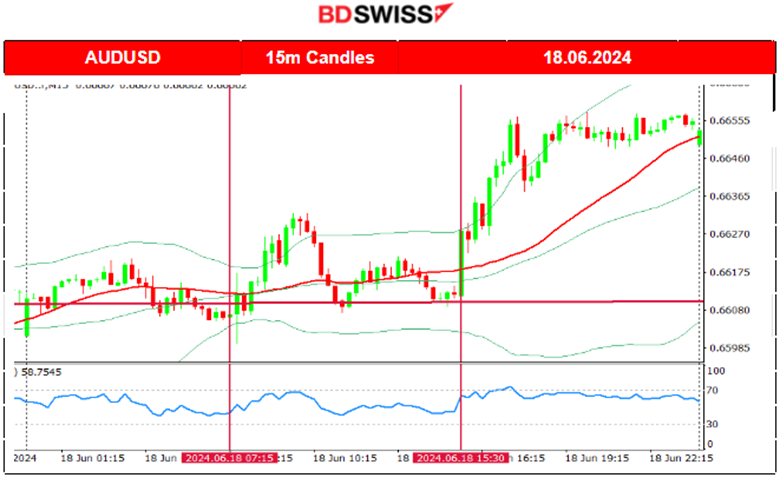
 AUDUSD (18.06.2024) 15m Chart Summary
Server Time / Timezone EEST (UTC+03:00)
Price Movement
The pair was moving sideways during the Asian session until the RBA announced the decision to keep rates steady and elevated. That caused a low-level intraday shock that did not cause a big deviation from the flat 30-period MA. However, as the start of the European session was approaching the USD was affected greatly causing more volatility for the pair. At 15:30 the USD depreciated heavily during the lower-than-expected figures for retail sales growth in the U.S. causing the pair to jump upwards and remain high until the end of the trading day.
 ___________________________________________________________________
CRYPTO MARKETS MONITOR
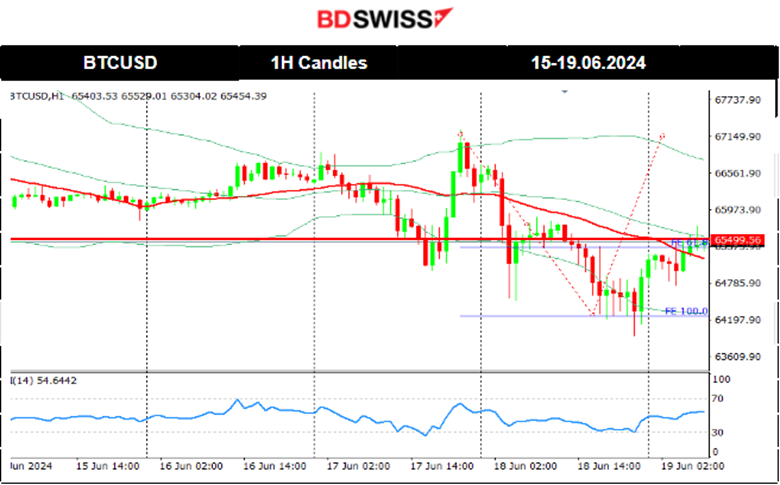
BTCUSD (Bitcoin) Chart Summary 1H
Server Time / Timezone EEST (UTC+03:00)
Price Movement
When the weekend passed, on the 17th, the market started to get active again and volatility labels rose. The price fell to 65K before reversing to the upside quite rapidly finding resistance close to 67,200 USD before retracing to the intraday mean. On the 17th, the price saw a fall reaching a support near 64,500 USD before it finally retraced to the 30-period MA. On the 18th, the price broke, and that support moved lower until it reached the next support at near 64K USD. Retarcement back to the 30-period MA followed soon indicating that the 65.5 USD acts as the important weekly mean at the moment. The MA though is still showing a prevailing downtrend.
 Crypto sorted by Highest Market Cap:
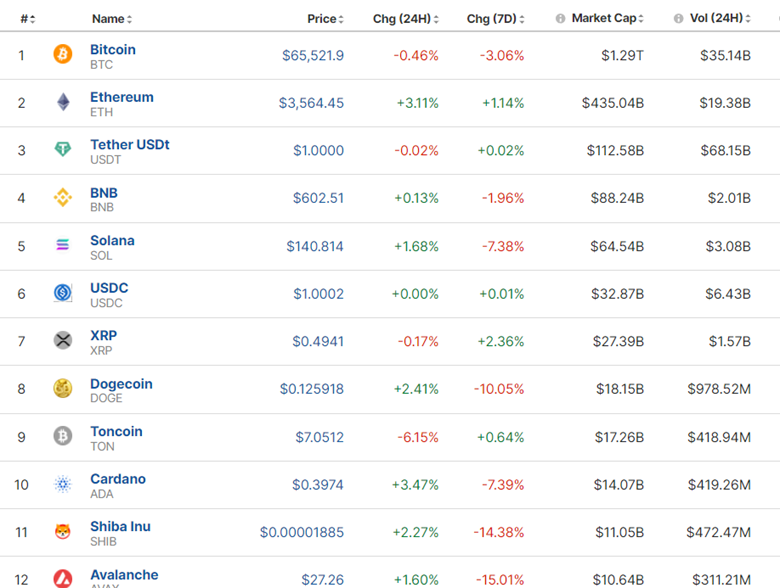
Volatility levels get higher and higher with some prices remaining high generating 24-hour gains. Overall, though, the market is not improving.
https://www.investing.com/crypto/currencies
______________________________________________________________________
EQUITY MARKETS MONITOR
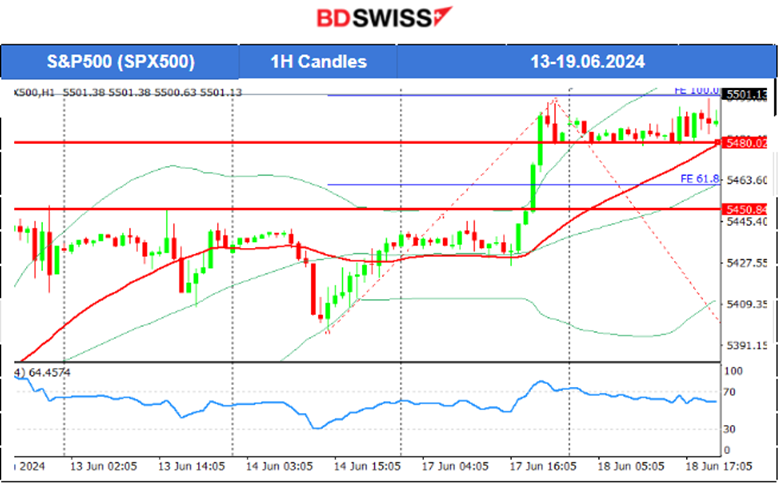
S&P500 (SPX500) 4-Day Chart Summary
Server Time / Timezone EEST (UTC+03:00)
Price Movement
A triangle formation was broken to the downside on the 14th of June and support near 5,400 USD was reached as mentioned in our previous analysis. The index reversed fully after that and it moved slightly above 5,440 USD, above what looks like to be a channel now. The level 5,445 USD acted as a resistance and it was broken on the 17th. The index jumped to the next resistance at near 5,500 USD before a slowdown. Retracement did not take place since 5,479-5,480 USD was not broken. Instead, it acted as a strong support that caused the index to bounce and move to the upside. Currently, it found resistance at 5,500 USD.
 ______________________________________________________________________
COMMODITIES MARKETS MONITOR
USOIL (WTI) 4-Day Chart Summary
Server Time / Timezone EEST (UTC+03:00)
Price Movement
The price of Crude oil was in a consolidation phase after a long uptrend. On the 17th the price moved above the 79 USD/b resistance and succeeded in a breakout of the upside, moving quite rapidly and reaching the next resistance at near 80 USD/b. Retracement took place on the 18th with the price returning to the 79.10 USD, 61.8 Fibo retracement level. However, on the same day, it turned to the upside, broke the 80 USD/b level and moved further upwards. Crude oil is breaking May’s resistance levels (latest 80.4), if the market does not experience an event that could shift things fundamentally then technically the price has the potential to reach 83 USD/b.
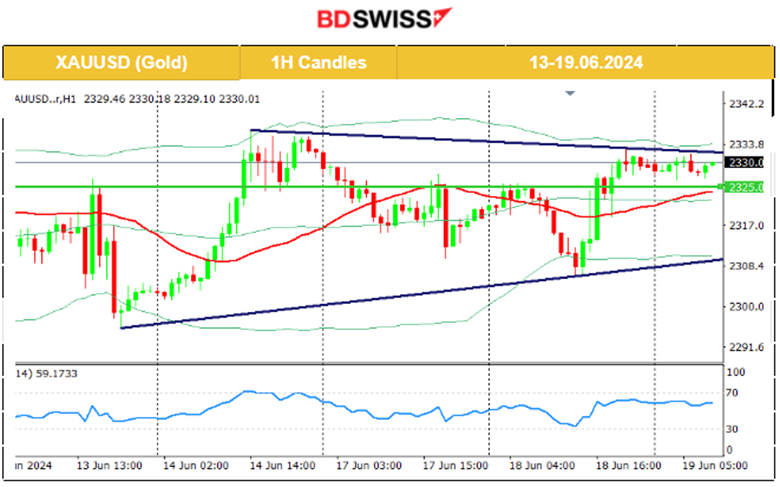
 XAUUSD (Gold) 4-Day Chart Summary
Server Time / Timezone EEST (UTC+03:00)
Price Movement
On the 14th of June, the price reversed to the upside and tested the resistance again, at near 2,340 USD/oz unsuccessfully. It reversed back to the 30-period MA and remained on a consolidation path with the mean price at near 2,320 USD/oz. A triangle was formed as volatility levels lowered and on the 18th of June, that triangle was broken to the downside. However, instead of the price moving lower, the weak U.S. retail sales figures caused USD depreciation on the 18th pushing gold to the upside. Another triangle formation is now visible as it found resistance. The price of 2,325 USD/oz seems to be the weekly mean and Gold could see more volatility today upon breakout of either the resistance 2,334 USD/oz or the support 2,325 USD/oz.
 ______________________________________________________________
News Reports Monitor – Today Trading Day (19.06.2024)
Server Time / Timezone EEST (UTC+03:00)
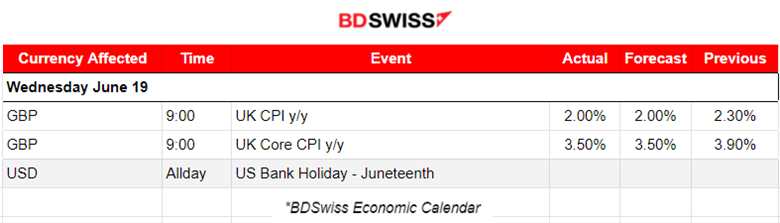
No important announcements, no special scheduled releases.
As per the U.K.’s CPI data report at 9:00, the Consumer Prices Index (CPI) rose by 2.0% in the 12 months to May 2024. As expected and on target finally! 2% reached. However, the market responded with GBP appreciation upon release.
General Verdict:
______________________________________________________________
 Marios Kyriakou
Posted on 06 September, 2024 at 10:55 GMT
Posted on 05 September, 2024 at 10:53 GMT
Posted on 04 September, 2024 at 12:19 GMT
Posted on 03 September, 2024 at 12:45 GMT
Posted on 02 September, 2024 at 10:36 GMT