BDSwiss App
Download & start trading


Rates as of 05:00 GMT
Market Recap
Is the US in recession? Technically, yes – we learned yesterday that Q2 GDP contracted at a 0.9% quarter-on-quarter annualized rate (qoq SAAR), following the 1.6% qoq SAAR decline in Q1. That means the US is in a technical recession. However using the criteria that the National Bureau of Economic Research (NBER) uses to define a recession, absolutely not – and the NBER has the final say in the matter. Watch for my Weekly Outlook later today for the full story.
Nonetheless, the market behaved yesterday as if the US is in recession. That’s probably because the data dovetailed with comments from Fed Chair Powell’s press conference Wednesday. He noted several areas where activity had slowed – consumer spending, housing activity, and business fixed investment – and said that “As the stance of monetary policy tightens further, it likely will become appropriate to slow the pace of increases while we assess how our cumulative policy adjustments are affecting the economy and inflation.” The market interpreted this to mean that the Fed is starting to pay attention to other factors besides inflation. If that’s the case, then two consecutive quarters of GDP contraction should certainly catch their collective eyes.
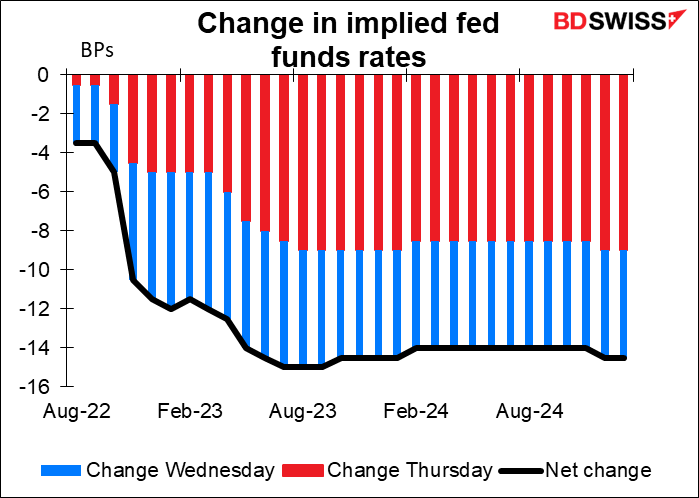
As a result, the market further reduced its expectations of Fed tightening.
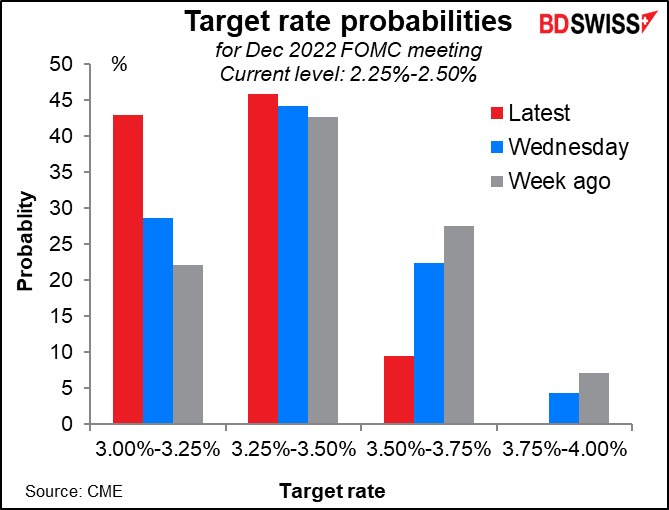
The odds that there would be only 75 bps more rate hikes this year – implying perhaps a 50 bps hike in September, a 25 bps hike in November, and no hike in December – increased while the odds of 125 bps more increases diminished.
Bond yields rallied hard around the world, especially at the short end of the curve, where they largely reflect expectations for central bank policy moves.

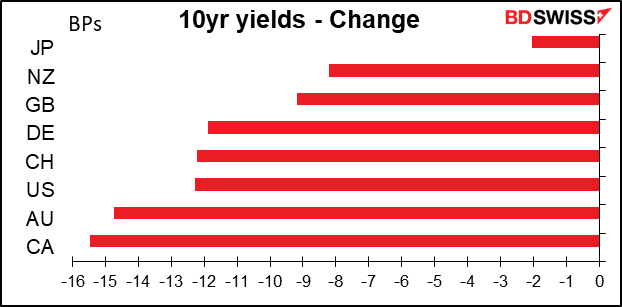
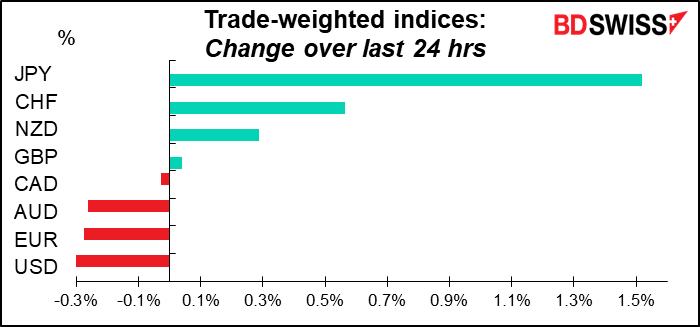
The change in yields – especially the change in two-year yields – pretty well explains the movement in currencies.

If we eliminate JPY, the currency with the extreme move, then the correlation with the change in 10-year yields plunges. But the correlation with 2-year yields remains almost the same.

Why did JPY appreciate so much? As expectations for further rate tightening in the US faded, the expected spread between US and Japanese rates narrowed somewhat. That pushed JPY up considerably. It was almost a 3 standard-deviation move for USD/JPY. The yen has appreciated a sharp 3.4% this week as Fed tightening fears are pared back.

I happen to believe that the market is making a mistake, for three reasons:
Third, monetary policy works with lags that are “both long and variable.” It can take up to 18 months for the full effect of monetary policy to work its way through the economy. It’s unrealistic to expect that the rate hikes the market expects to see by December will be enough to cause inflation to come back down to 2% and get the Fed to start easing by next February, which is what the market is now forecasting.
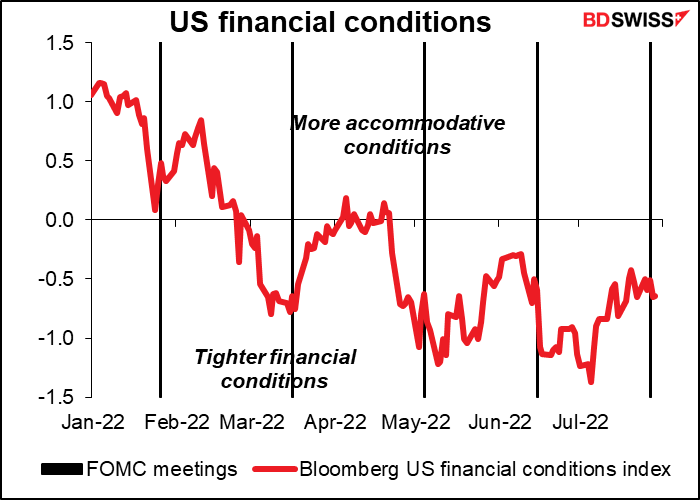
In fact markets have gotten so excited about the prospects of the Fed easing up that financial conditions are now looser than they were after the June FOMC meeting. The market is undoing some of the Fed’s work, which will only force it to tighten further in the future. I remain bullish USD over the next several months.
Today’s market

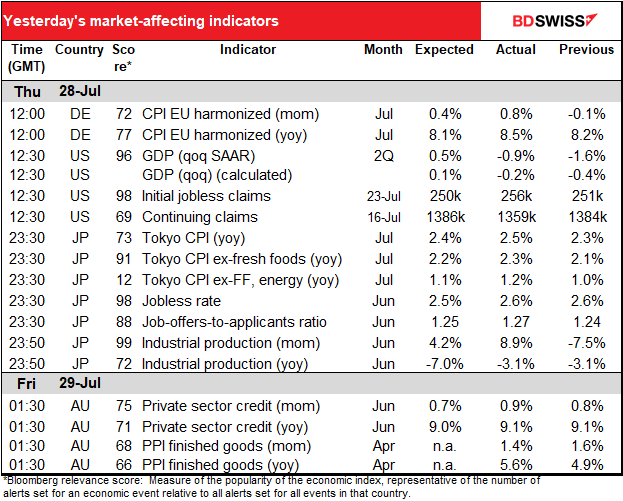
Note: The table above is updated before publication with the latest consensus forecasts. However, the text & charts are prepared ahead of time. Therefore there can be discrepancies between the forecasts given in the table above and in the text & charts.
Lots on the schedule today!
The European day starts out with German unemployment. After last month’s shocking rise in the number of unemployment claims, the market expects another rise but much smaller. The unemployment rate is forecast to move higher as well.

In any case I think the market will be more concerned about the German GDP figure that’ll be announced five minutes later. It’s not expected to be great – up just 0.1% qoq. Of course who knows? Three months from now we could be looking back on that figure wistfully and wondering where the growth went to.

By the way, France announced its GDP 2 ½ hours ago, Spain 1 hour ago, and Italy announces its GDP at the same time as Germany, so when the EU-wide GDP comes out in an hour, people at the investment banks will have a pretty good idea what the EU-wide GDP figure will be, since those four countries account for some 76% of Eurozone GDP.
Bank of England’s data on UK mortgage approvals is the only UK indicator out this week. Approvals have been slowing for some time now but they’re only just back to the 2018-19 average. The forecast for this month would be almost exactly in line with that average. This suggests the housing market is back to “normal.” Below this and we’ll be seeing the impact of the Bank of England’s tightening measures.

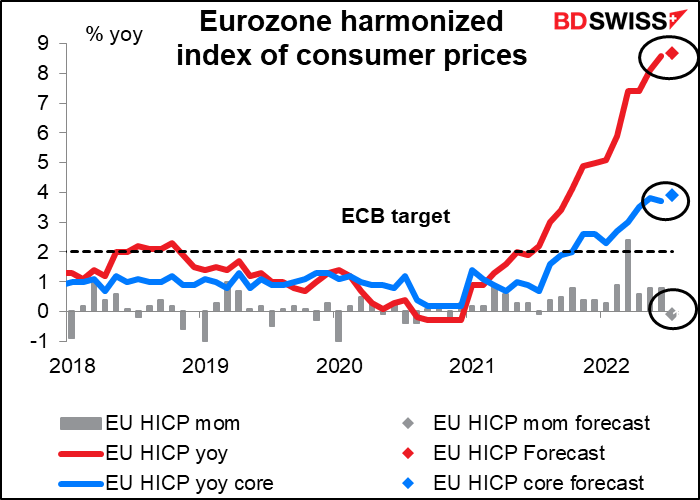
Next up is the all-important Eurozone harmonized index of consumer prices (HICP). On a month-on-month basis prices are expected to fall, but the year-on-year rate is forecast to accelerate slightly both at the headline and core levels. We could be in for a surprise though — yesterday’s German HICP was well above estimates, rising to 8.5% yoy from 8.2% vs the market consensus that it would slow to 8.1%.
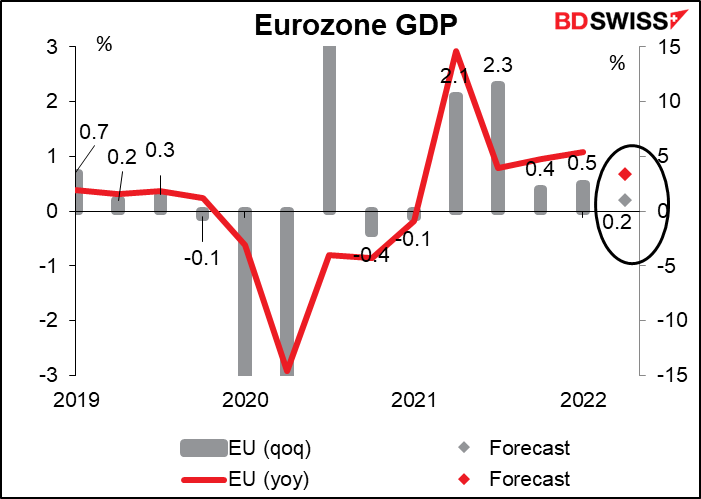
At the same time as we get the EU CPI we also get the EU Q2 GDP. As mentioned above, more than 75% of the data behind this figure is already released so by the time it comes out most of the dealing desks have had a chance to position themselves accordingly. I therefore don’t think there’s likely to be a major surprise and probably no extreme volatility on the news.
As with Germany, growth is slowing and according to the recent purchasing managers’ indices (PMIs), it’s expected to slow further. In a few months we may look back on this tepid number as “the good old days.”
Canada’s GDP is expected to decline 0.2% month-on-month in May, but even so, the year-on-year pace of growth is forecast to rise to 5.3% from 5.0%. That would put output 2.1% above the pre-pandemic level. I don’t think this would give the Bank of Canada any cause to pause. The Bank said it expects growth of 3 ½% yoy this year and this number wouldn’t necessarily push the economy off course from that. Accordingly I think it’s likely to be neutral for CAD.

Next up are the two intertwined data series of US personal consumption expenditure (PCE) deflators and US personal income & spending.
The PCE deflators are in theory the Fed’s preferred inflation gauges and the ones that they forecast every quarter in their Summary of Economic Projections. Yet the fact is that when talking, Committee members usually refer to the CPI, not the PCE deflators, and so the market treats these as second-tier data. Nonetheless they’re likely to be worrisome: the year-on-year growth rate of the headline figure is expected to rise 0.5 percentage point, more than the rise in the CPI during the month (0.3 ppt), although the core figure, the more important of the two, is expected to be unchanged.
That indicates that energy prices are a major reason for the continued rise in the headline figure, which is good news, seeing as energy prices have been declining – retail gasoline averaged $4.93 a gallon during June, but so far during July has averaged $4.61, a 6.5% decline.

At the same time, US personal income is expected to be up a pretty healthy 0.5% as month-on-month as more and more people are working, while personal spending is forecast to rise an even higher 0.9% mom. Such figures are likely to confirm that the US economy, which is largely driven by consumption, is still going strong. That should be positive for the dollar.

The US employment cost index (ECI) will go together with the PCE deflators to add to our insight about US inflation. The growth rate is expected to slow a bit on a quarter-on-quarter rate from Q1’s record rise, but the year-on-year rate is forecast to hit a record this time (data back to 1996). In other words, labor costs for companies are rising at the fastest pace in at least 26 years. That may force companies to keep raising their prices to keep up with rising labor costs – a vicious circle that the Fed will have to break by raising interest rates.


 Marshall Gittler
Posted on 14 May, 2024 at 15:21 GMT
Posted on 13 May, 2024 at 12:29 GMT
Posted on 10 May, 2024 at 16:40 GMT
Posted on 09 May, 2024 at 17:28 GMT