BDSwiss App
Download & start trading


Rates as of 05:00 GMT

Market Recap
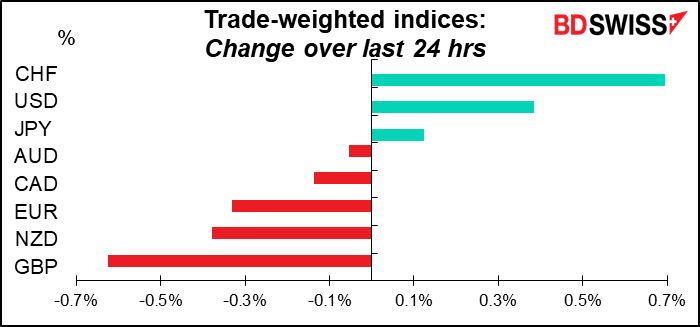
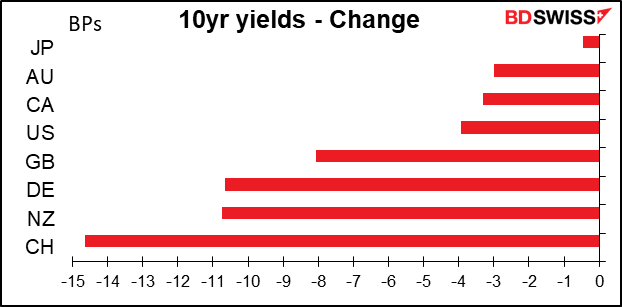
Looking at the second graph above, today seems to be largely a continuation of yesterday – most of the currencies fall pretty neatly on the green “continuation” line. The exceptions are currencies that haven’t changed that much today.
If we exclude CHF and USD, then currencies largely moved in line with their bond markets. GBP is doing worse than the others given the performance of its bond market, probably because of the political issues there. There may also have been some reaction to the hearing for incoming Monetary Policy Committee (MPC) member Swati Dhingra. She said that she favors a “gradual approach” to raising rates. Since she is replacing Michael Saunders, one of the most hawkish members of the MPC, this meas less support for rapid tightening in the future.

You can see then what outliers CHF and USD are when we include them in this chart.

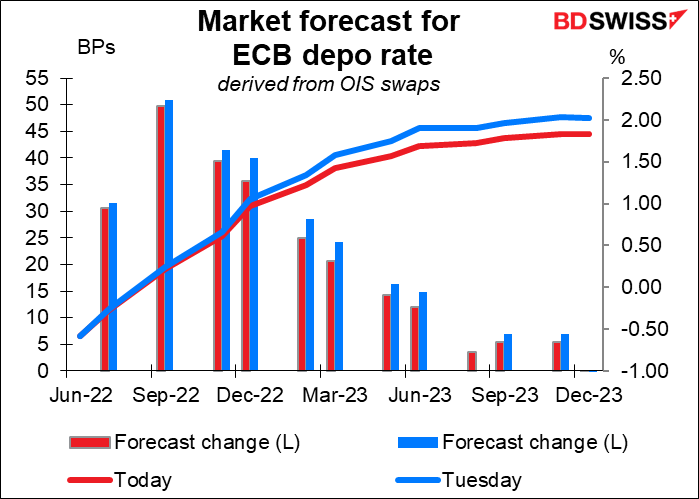
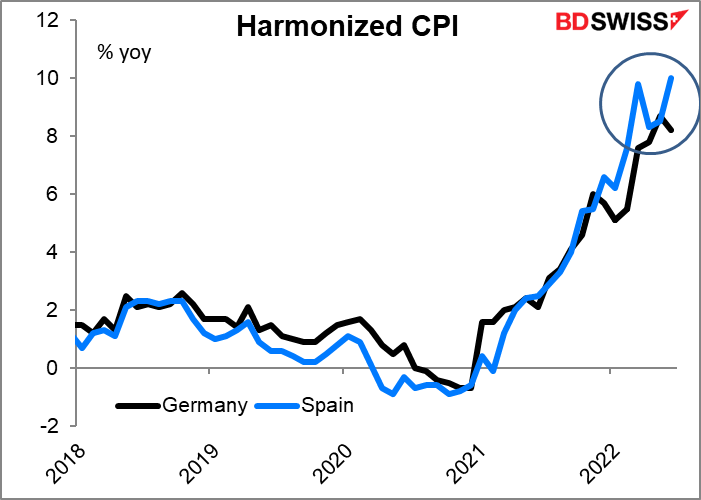
We discussed yesterday how the market is reassessing the outlook for Swiss National Bank (SNB) tightening over the next two years. Meanwhile, yesterday the market reassessed the outlook for European Central Bank (ECB) tightening after a downward surprise in the German harmonized index of consumer prices (HICP) (see table above).
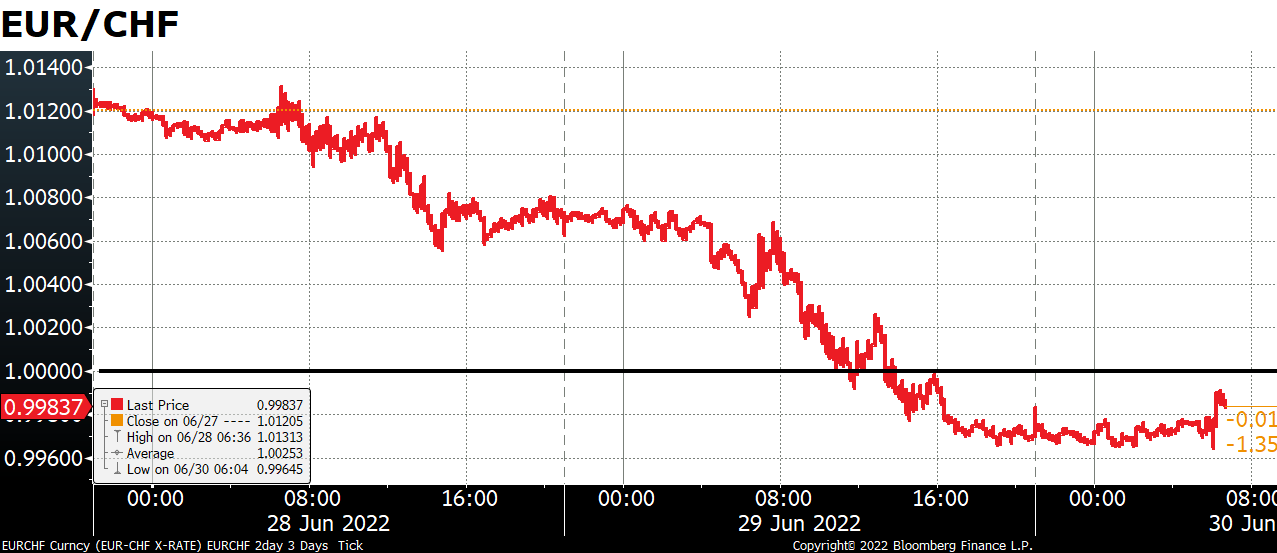
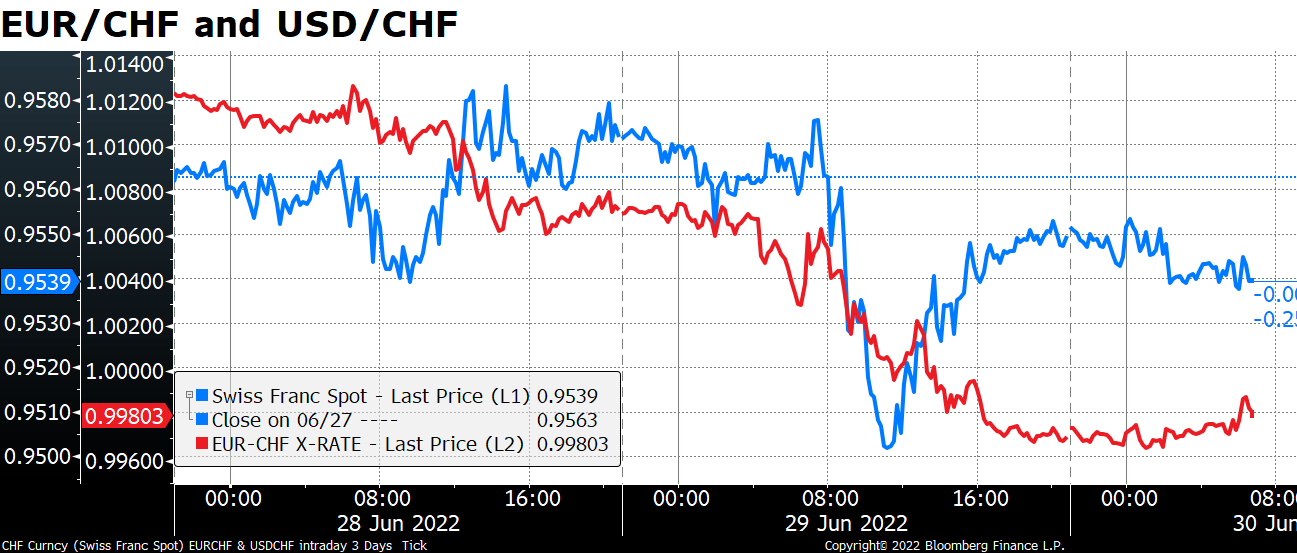
That, together with weak risk sentiment, month-end flows, and a worsening European growth outlook caused EUR/CHF to break below parity for the first time since the SNB removed the EUR/CHF floor in 2015. (It briefly broke through that level in March of this year during trading but didn’t close there – the lowest close I have was 1.00239 on March 4th.)

USD/CHF however bounced back.
I’m doubt whether the surprise fall in German CPI signals a lasting change in the Eurozone inflation outlook. It was probably temporary, as the government reduced fuel taxes and public transport prices for three months. This policy-related fall in prices should reverse in September when the taxes go back to normal. Furthermore, the downside surprise in Germany contrasts with an upside surprise in Spain, where the HICP jumped to 10.0% yoy from 8.5% (8.7% expected).
The amazing thing in the markets is that despite more hawkish comments from Fed Chair Powell and ECB President Lagarde at the ECB’s symposium in Sintra yesterday and remarks that perhaps the days of low inflation are over, both bond yields and inflation expectations fell sharply yesterday.

According to the FT, Powell and Lagarde said the pandemic and the Ukraine war were reversing many of the factors that had spurred more than a decade of ultra-low inflation among most developed economies. They warned that the splintering of the global economy into competing blocs risked fracturing supply chains, reducing productivity, raising costs and reducing growth. “I don’t think that we’re going to go back to that environment of low inflation,” said Lagarde. “There are forces that have been unleashed as a result of the pandemic [and]as a result of this massive geopolitical shock that are going to change the picture and the landscape within which we operate.”
The fact that bond yields and inflation expectations fell nonetheless suggests that people are expecting a recession in the near future.
Today’s market
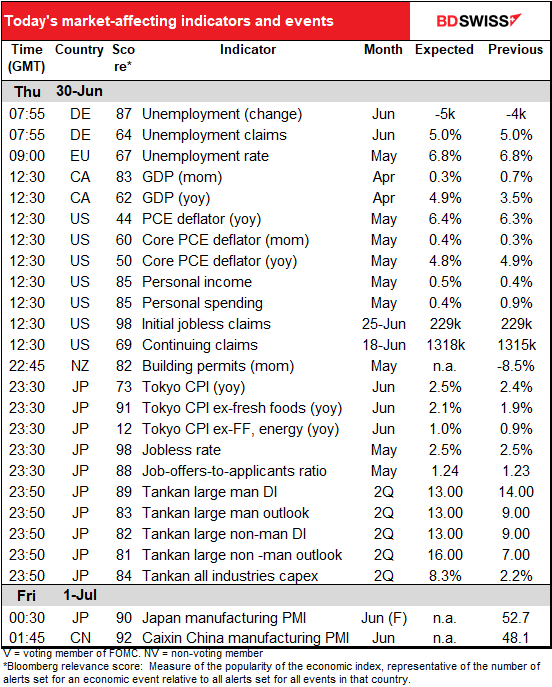
Note: The table above is updated before publication with the latest consensus forecasts. However, the text & charts are prepared ahead of time. Therefore there can be discrepancies between the forecasts given in the table above and in the text & charts.
Lots on the schedule today!
German unemployment for June is expected to be little changed: the unemployment rate is forecast to remain the same as the number of unemployed persons drops a pitiful 5k (out of a labor force of 42.52mn). Improvement in the labor market seems to have peaked in January while the unemployment rate has been stuck at 5.0% since March.

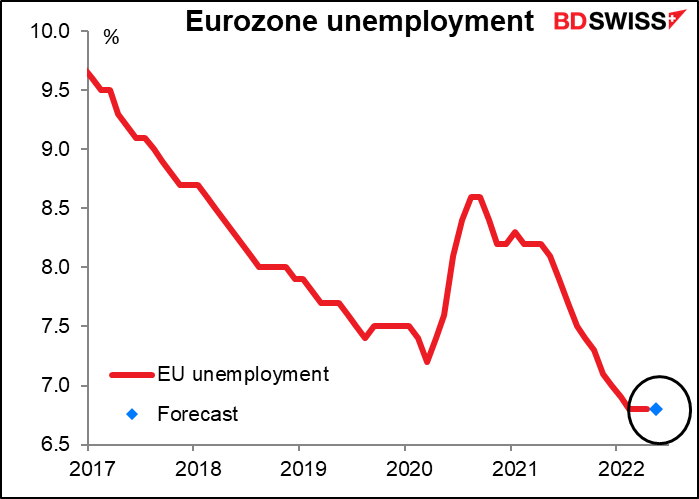
An hour later we get the Eurozone-wide unemployment rate for May. It’s expected to be unchanged at 6.8% for the fourth month in a row. That’s the lowest rate on record (data back to the founding of the Euro in 1998). But who cares? The European Central Bank (ECB) doesn’t have an employment mandate. This will neither help nor hinder ECB rate hikes. EUR-neutral
 Canada’s monthly GDP is expected to rise further but at a far slower pace than in the preceding two months. There have been positive contributions from retail, wholesale trade, transportation/warehousing, and mining/quarrying/oil & gas extraction, partially offset by lower output in the real estate, manufacturing, and construction industries. While this would be a slowdown – the six-month moving average is +0.5% a month – it would put output 2.2% above the pre-pandemic level so a pretty full recovery. In that case I think the Bank of Canada still has a good argument for removing more of its extraordinary accommodation. I would see it as still positive for CAD.

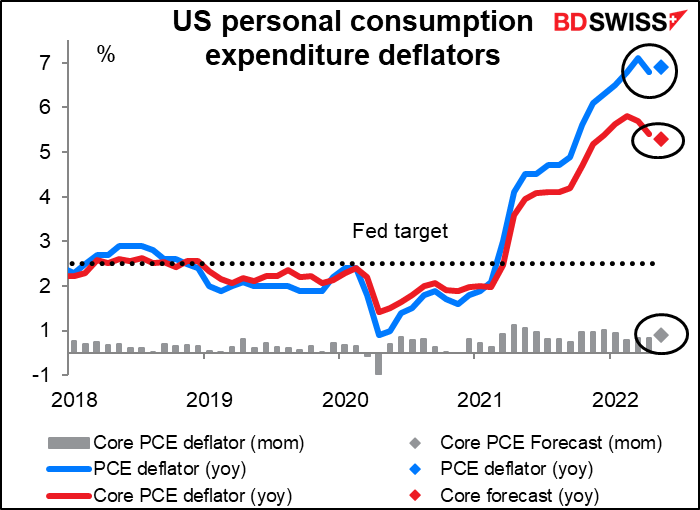
Next up is the big indicator of the day, the US personal income and spending data, with its sidekick, the personal consumption expenditure (PCE) deflators. The PCE deflators are in theory what the Fed uses to gauge inflation, although I have to admit I hear Fed officials talking more about the consumer price index (CPI).
Personal income is forecast to be up 0.5% mom, 0.10 bps more than in the previous month, while spending is forecast to be up 0.4% mom, which would be down sharply from +0.9% the month before. Growth in spending substantially exceeded growth in incomes three out of the first four months of the year. It would be only normal for people to cut back on spending after a run like that.
Nonetheless, the continued growth in both incomes and spending bodes well for the economy going forward. If people start cutting back on their spending, that would contribute to starting a recession because one person’s spending is another person’s income. It appears that people are willing to draw down some of their savings to maintain their spending.

As for the personal consumption expenditure (PCE) deflators, the core index – the more important of the two – is expected to slow for the third month in a row. However the headline figure, which slowed in April, is expected to tick back up again.
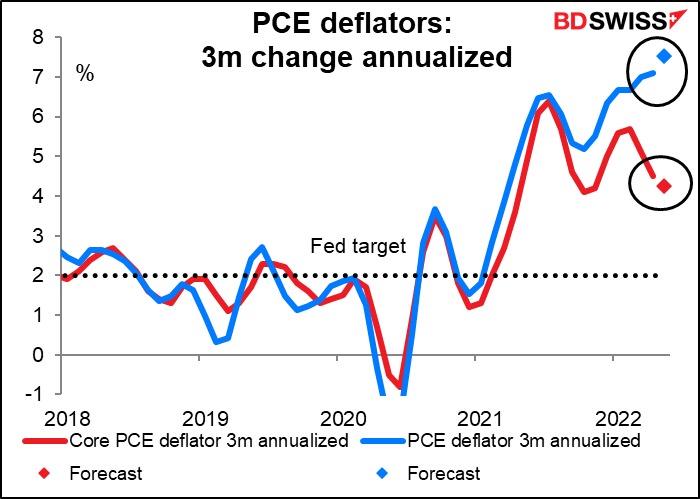
So is US inflation slowing or accelerating according to these measures? The answer is “yes,” unfortunately. As in, it depends on which one you’re looking at. If we look at the three-month change annualized, which is more sensitive to recent developments, we see that the two measures have diverged. The core rate of inflation peaked in February and has been slowing ever since (and is expected to slow further in May). But the headline figure just keeps going higher and higher. The Fed emphasizes the core PCE deflator, which they said “historically has been a better indicator of where inflation will be in the future than the overall figure.” So perhaps we can hope that inflation has indeed peaked. But we’ll probably have to see it reflected in the headline figure before people start betting on it. USD+
Which of these variables should you watch? There are six variables that come out at the same time: month-on-month change in incomes, spending, PCE deflator, and core PCE deflator, plus yoy changes in the two deflators as well. Which ones are the most important?
For EUR/USD, I’d say it’s the year-on-year change in the core PCE deflator. That has the highest R-squared and therefore the strongest explanatory power. However, it’s also notable how many of the “surprises” were actually zero – the consensus forecast was spot on. That may distort the statistics.

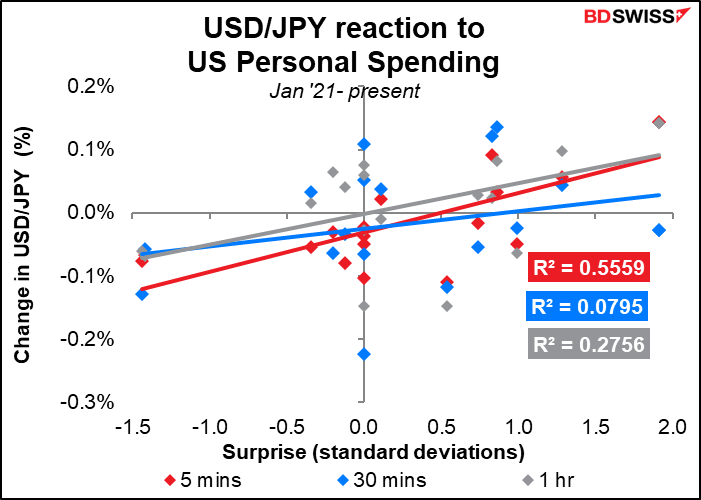
The personal spending figure has a strong immediate impact but it fades quickly.

The personal income figure on the other hand has virtually no explanatory power.
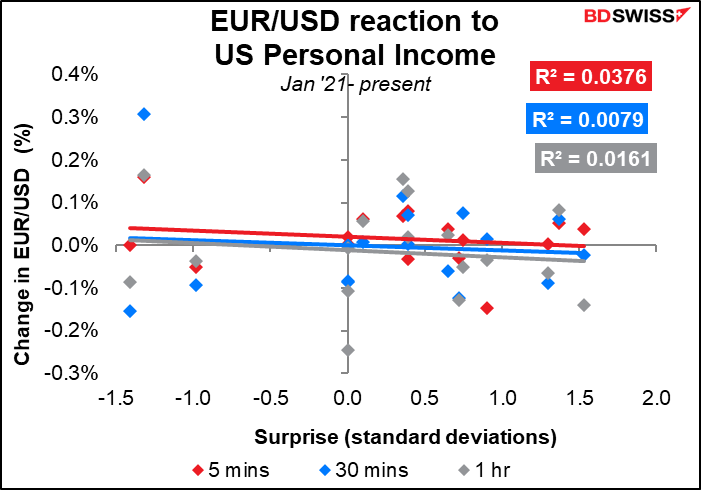
Nor does the month-on-month change in the core PCE deflator, even though that has the highest Bloomberg relevance score of any of the four deflators. The mom change in the headline PCE deflator is no better. The problem may be again that the consensus forecast is often spot on so there is no surprise, as this chart shows.

As for other currencies, USD/JPY seems to have the strongest reaction to these indicators. It too is most strongly moved by the personal spending.
For GBP/USD however the connection to any of them is tenuous, and at the 30-minute and 1-hour level there is no significant statistical relationship. I suggest anyone planning on trading this indicator should use EUR/USD or USD/JPY, not GBP/USD.

US initial jobless claims have been gradually rising since early April but this week they’re expected to be unchanged.

Then we wait for the sun to make its daily peregrination across the sky and for Asia to wake up.
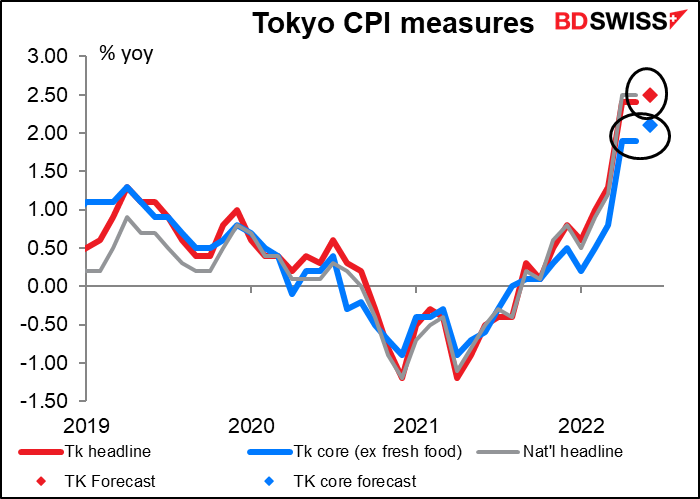
As it’s the end of the month, there’s the usual deluge of Japanese indicators today. First up is the Tokyo consumer price index (CPI). It’s expected to show the headline rate of inflation up a mere 0.10 percentage points to 2.5%, which would be the same as the national CPI last month – in other words, no acceleration in inflation. The Japanese-style “core” rate, which excludes only fresh foods, is forecast to rise 20 ppt, a bit more but still hardly troublesome.
Not shown, the Bank of Japan’s “core-core” measure, which is what passes for core inflation in other countries (excluding food & energy) is forecast to rise 10 ppt to an amazingly low 1.0%, still well below the Bank of Japan’s 2% target. So there may be some substance to the BoJ’s argument that it’s too early to remove the monetary stimulus even if every other country in the world is doing so, because Japan’s circumstances are different. That’s negative for the yen.
The unemployment rate is forecast to be unchanged at 2.5%, while the job-offers-to-applicants ratio is forecast to edge up one tic.

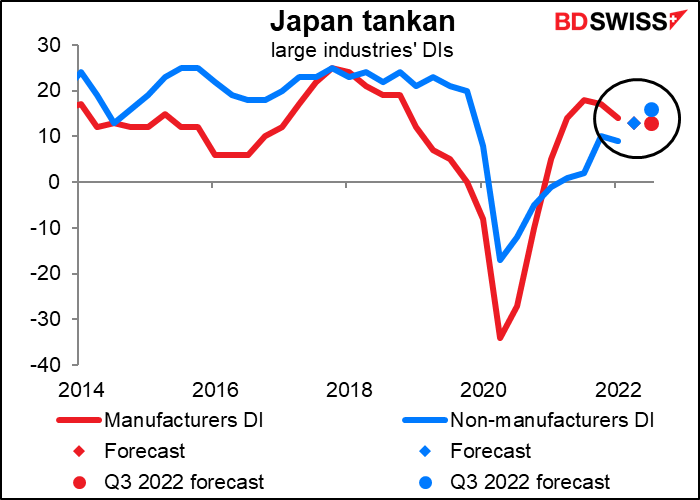
And as it’s the end of the quarter, we also get the renowned Bank of Japan Short-Term Economic Survey of Enterprises in Japan, usually referred to by its Japanese acronym, the tankan. The large manufacturers’ DI is forecast to fall one point to 13, while the large non-manufacturers DI is expected to rise 4 points to 13 (which is why there’s only a blue square, not a blue & a red one – they’re on top of each other). The tankan also includes companies’ forecasts of how things will be one quarter from now. The market’s forecast for that forecast for large manufacturers is also 13 – i.e., no improvement — while for large non-manufacturers it’s expected to improve by a further 3 points.
I think the peaking of the manufacturers’ DI could be seen as bolstering the government’s case that monetary policy has to remain accommodative, which could be negative for the yen.


 Marshall Gittler
Posted on 23 April, 2024 at 11:46 GMT
Posted on 22 April, 2024 at 14:46 GMT
Posted on 19 April, 2024 at 13:15 GMT
Posted on 18 April, 2024 at 13:00 GMT
Posted on 17 April, 2024 at 15:37 GMT